Market Outlook
December 28, 2016
Market Cues
Domestic Indices
Chg (%)
(Pts)
(Close)
Indian markets are expected to open positive tracking the SGX Nifty.
BSE Sensex
1.6
406
26,213
Nifty
1.6
125
8,033
U.S. markets finished slightly higher on Tuesday in sluggish trade following the
Christmas holiday. The Dow Jones Industrial Average rose 0.1%, to end at 19,945,
Mid Cap
1.7
197
11,703
remaining just shy of the psychologically important 20,000 milestone. The Nasdaq
Small Cap
1.5
172
11,721
Composite however, notched a record close, finishing with a gain of 0.5% at 5,487.
Bankex
1.3
264
20,412
The S&P 500 notched a minor rise, up 0.2% at 2,269.The UK markets were closed
on Monday.
Global Indices
Chg (%)
(Pts)
(Close)
Indian market ended on a strong positive note yesterday shrugging off the negativity
Dow Jones
0.1
11
19,945
accumulated over last many weeks. BSE Sensex closed higher by 406 points to
Nasdaq
0.5
25
5,487
26,213 while the Nifty 50 of the NSE rose 125 points to 8,033. The rebound came
after Monday’s highly volatile session, which was sparked after PM’s comment on
FTSE
0.1
4
7,068
tax regime. The market however saw strong support in Finance Minister’s comment
Nikkei
0.0
1
19,404
which indicated of globally competitive tax rate regime and possible tax rate cuts in
Hang Seng
(0.3)
(58)
21,517
the upcoming budget. He has assured the markets that the government has no
Shanghai Com
(0.1)
(3)
3,112
intention to impose tax on long-term capital gains on share earnings.
News Analysis
Advances / Declines
BSE
NSE
GSFC’s chemicals business gets profitability boost
Advances
1,724
1,175
Detailed analysis on Pg2
Declines
874
423
Unchanged
164
84
Investor’s Ready Reckoner
Key Domestic & Global Indicators
Volumes (` Cr)
Stock Watch: Latest investment recommendations on 150+ stocks
BSE
2,419
Refer Pg5 onwards
NSE
14,367
Top Picks
CMP
Target
Upside
Company
Sector
Rating
Net Inflows (` Cr)
Net
Mtd
Ytd
(`)
(`)
(%)
Amara Raja Batt. Auto & Auto Ancill.
Buy
870
1,167
34.2
FII
(1,461)
(4,845)
22,433
Alkem Laboratories Pharmaceuticals
Buy
1,608
1,989
23.7
MFs
336
2,584
40,770
HCL Tech
IT
Buy
803
1,000
24.5
Power Grid Corp. Power
Buy
181
223
23.1
Top Gainers
Price (`)
Chg (%)
Navkar Corp.
Others
Buy
160
265
65.7
More Top Picks on Pg3
Bharatfin
519
8.0
Manappuram
63
6.7
Key Upcoming Events
Gppl
133
6.6
Previous
Consensus
Date
Region
Event Description
Reading
Expectations
Aloktext
3
6.5
Dec 27 US
Initial Jobless Claims
275.00
--
Nationalum
58
6.5
Dec 29 US
Consumer Confidence
107.1
108.5
Jan 01 China
PMI Manufacturing
51.7
51.6
Top Losers
Price (`)
Chg (%)
Jan 02 Germany Unemployment Change (000’s)
(5.00)
(5.00)
Jan 03 Germany PMI Manufacturing
55.5
55.5
Tvsmotor
352
(3.8)
More Events on Pg4
Network18
31
(2.1)
Unitech
4
(2.0)
Justdial
324
(1.8)
Bluedart
4,179
(1.7)
As on December 27, 2016
Market Outlook
December 28, 2016
News Analysis
GSFC’s chemicals business gets profitability boost
The two year high caprolactam prices is likely to benefit Gujarat State Fertilizers
and Chemicals. With a 56% share, GSFC is the leader in India's market for
caprolactam. It is the primary product of GSFC’s industrial products business. It is
used to produce nylon fibres for textiles, engineering resins and films. In fiscal
2015, around 38% of GSFC’s revenues were generated from the industrial
products business.
But as caprolactam rates fell, tracking the slump in global commodity prices,
GSFC’s industrial products business came under pressure. However, things are
improving from the July-September quarter. From $600 per metric tonne (mt) in
January-March and $625 in the June quarter, caprolactam-benzene spreads
improved to $735 in September.
With caprolactam now reaching $1,830 per mt, estimates are that caprolactam-
benzene spreads have reached $1,000 per mt. Benzene, a derivative of crude oil,
is feedstock for caprolactam. The spread or the price difference is used to gauge
profitability in the caprolactam business.
The stock, at around 12x the current consensus fiscal earnings per share, is not
expensive, stable caprolactam-benzene spreads and an improvement in fertilizer
business will be key for continuation of positive momentum. The stock has moved
from `80 in November to `91 in December, so caprolactam prices will be a key
variable for the stock going ahead.
Economic and Political News
`breaches 68-level, tanks 32 paise on dollar scare
Unorganised sector to be worst-hit by note ban
In Nov, only 16% of total gold imports was duty-free for exports
MMRDA initiated `80,000cr worth projects in 2016
Corporate News
Cigarette stocks zoom, 76 stocks hit 52-wk lows
IT and pharma to lead in 2017: HDFC Sec
Tata Sons' notice to Mistry for confidentiality breach
Tata Motors gains from BRTS rollout
Market Outlook
December 28, 2016
Top Picks ★★★★★
Large Cap
Market Cap
CMP
Target
Upside
Company
Rationale
(` Cr)
(`)
(`)
(%)
To outpace battery industry growth due to better
Amara Raja Batteries
14,858
870
1,167
34.2
technological products leading to market share gains in
both the automotive OEM and replacement segments.
Strong growth in domestic business due to its leadership in
Alkem Laboratories
19,221
1,608
1,989
23.7
acute therapeutic segment. Alkem expects to launch more
products in USA, which bodes for its international business.
The stock is trading at attractive valuations and is factoring
HCL Tech
1,13,330
803
1,000
24.5
all the bad news.
Back on the growth trend; expect a long term growth of 14%
Infosys
2,29,522
999
1,249
25.0
to be a US$20bn in FY2020.
Strong order backlog and improvement in execution would
Larsen & Tourbo
1,26,326
1,354
1,634
20.6
trigger the growth for the L&T
One of the largest pharma companies with strong
international presence. It has a rich pipeline of ANDAs
Lupin
65,143
1,443
1,809
25.4
which is also one of the largest among the generic
companies.
Going forward, we expect the company to report strong
Power Grid Corporation
94,744
181
223
23.1
top-line CAGR of ~16% and bottom-line CAGR of ~19%
over FY16-18 on back of strong capitalization guidance
Source: Company, Angel Research
Mid Cap
Market Cap
CMP
Target
Upside
Company
Rationale
(` Cr)
(`)
(`)
(%)
We expect the company would report strong profitability
Asian Granito
638
212
351
65.4
owing to better product mix, higher B2C sales and
amalgamation synergy.
Among the top 4 players in the consumer durables segment.
Bajaj Electricals
2,120
209
274
30.7
Improved profitability backed by turn around in E&P
segment. Strong order book lends earnings visibility.
Favourable outlook for AC industry augurs well for Cooling
Blue Star
4,278
448
634
41.6
products business which is outgrowing the market. EMPPAC
division's is likely to turn around on improving economy
With a focus on the low and medium income (LMI)
Dewan Housing Finance
7,471
239
350
46.7
consumer segment, the company has increased its presence
in tier-II & III cities where the growth opportunity is immense.
Strong loan growth backed by diversified loan portfolio and
adequate CAR. ROE & ROA likely to remain decent as risk of
Equitas Holdings
4,752
142
235
65.8
dilution remains low. Attractive valuations considering
growth.
Economic recovery to have favourable impact on advertising
& circulation revenue growth. Further, the acquisition of a
Jagran Prakashan
5,412
166
225
35.9
radio business (Radio City) would also boost the company's
revenue growth.
Speedier execution and speedier sales, strong revenue
Mahindra Lifespace
1,423
347
522
50.5
visibilty in short-to-long run, attractive valuations
We expect the company to report strong growth on back of
healthy growth in domestic branded sales (owing to
Mirza International
993
83
107
29.7
aggressive ad spend and addition in the number of EBOs &
multi-brand outlets [MBOs]) and healthy export revenues.
Massive capacity expansion along with rail advantage at
Navkar Corporation
2,281
160
265
65.7
ICD as well CFS augurs well for the company.
Strong brands and distribution network would boost growth
Siyaram Silk Mills
1,125
1,200
1,605
33.8
going ahead. Stock currently trades at an inexpensive
valuation.
Market leadership in Hindi news genre and no. 2 viewership
ranking in English news genre, exit from the radio business,
TV Today Network
1,538
258
385
49.3
and anticipated growth in ad spends by corporate to benefit
the stock.
Source: Company, Angel Research
Market Outlook
December 28, 2016
Key Upcoming Events
Global economic events release calendar
Date
Time
Country
Event Description
Unit
Period
Bloomberg Data
Last Reported Estimated
Dec 27, 2016
8:30PM
US
Consumer Confidence
S.A./ 1985=100
Dec
107.10
108.50
Dec 29, 2016
7:00PM
US
Initial Jobless claims
Thousands
Dec 24
275.00
265.00
Jan 1, 2017
2:25PM
Germany
PMI Manufacturing
Value
Dec F
55.50
55.50
Jan 2, 2017
6:30AM
China
PMI Manufacturing
Value
Dec
51.70
51.50
Jan 3, 2017
3:00PM
UK
PMI Manufacturing
Value
Dec
53.40
53.20
3:30PM
Euro Zone
Euro-Zone Consumer Confidence
Value
Dec F
(5.10)
(5.80)
Jan 4, 2017
2:25PM
Germany
Unemployment change (000's)
Thousands
Dec
(5.00)
(5.00)
Jan 6, 2017
2:25PM
Germany
PMI Services
Value
Dec F
53.80
53.80
7:00PM
US
Change in Nonfarm payrolls
Thousands
Dec
178.00
175.00
7:00PM
US
Unnemployment rate
%
Dec
4.60
4.70
Jan 8, 2017
China
Exports YoY%
% Change
Dec
(1.60)
--
Jan 9, 2017
China
Consumer Price Index (YoY)
% Change
Dec
2.30
--
Jan 10, 2017
India
Imports YoY%
% Change
Dec
10.40
--
India
Exports YoY%
% Change
Dec
2.30
--
Jan 11, 2017
3:00PM
UK
Industrial Production (YoY)
% Change
Nov
(1.10)
--
Jan 12, 2017
5:30PM
India
Industrial Production YoY
% Change
Nov
(1.90)
--
Jan 13, 2017
US
Producer Price Index (mom)
% Change
Dec
--
--
Jan 16, 2017
3:00PM
UK
CPI (YoY)
% Change
Dec
1.20
--
Jan 17, 2017
12:00PM
India
Monthly Wholesale Prices YoY%
% Change
Dec
3.15
--
China
Industrial Production (YoY)
% Change
Dec
6.20
--
China
Real GDP (YoY)
% Change
4Q
6.70
--
Jan 18, 2017
7:00PM
US
Consumer price index (mom)
% Change
Dec
0.20
--
3:30PM
Euro Zone
Euro-Zone CPI (YoY)
%
Dec F
0.60
--
3:00PM
UK
Jobless claims change
% Change
Dec
2.40
--
7:45PM
US
Industrial Production
%
Dec
(0.44)
--
Jan 19, 2017
7:00PM
US
Housing Starts
Thousands
Dec
1,090.00
--
7:00PM
US
Building permits
Thousands
Dec
1,212.00
--
8:30PM
US
Existing home sales
Million
Dec
5.61
--
Jan 24, 2017
3:00PM
UK
GDP (YoY)
% Change
4Q A
2.20
--
Source: Bloomberg, Angel Research
Market Outlook
December 28, 2016
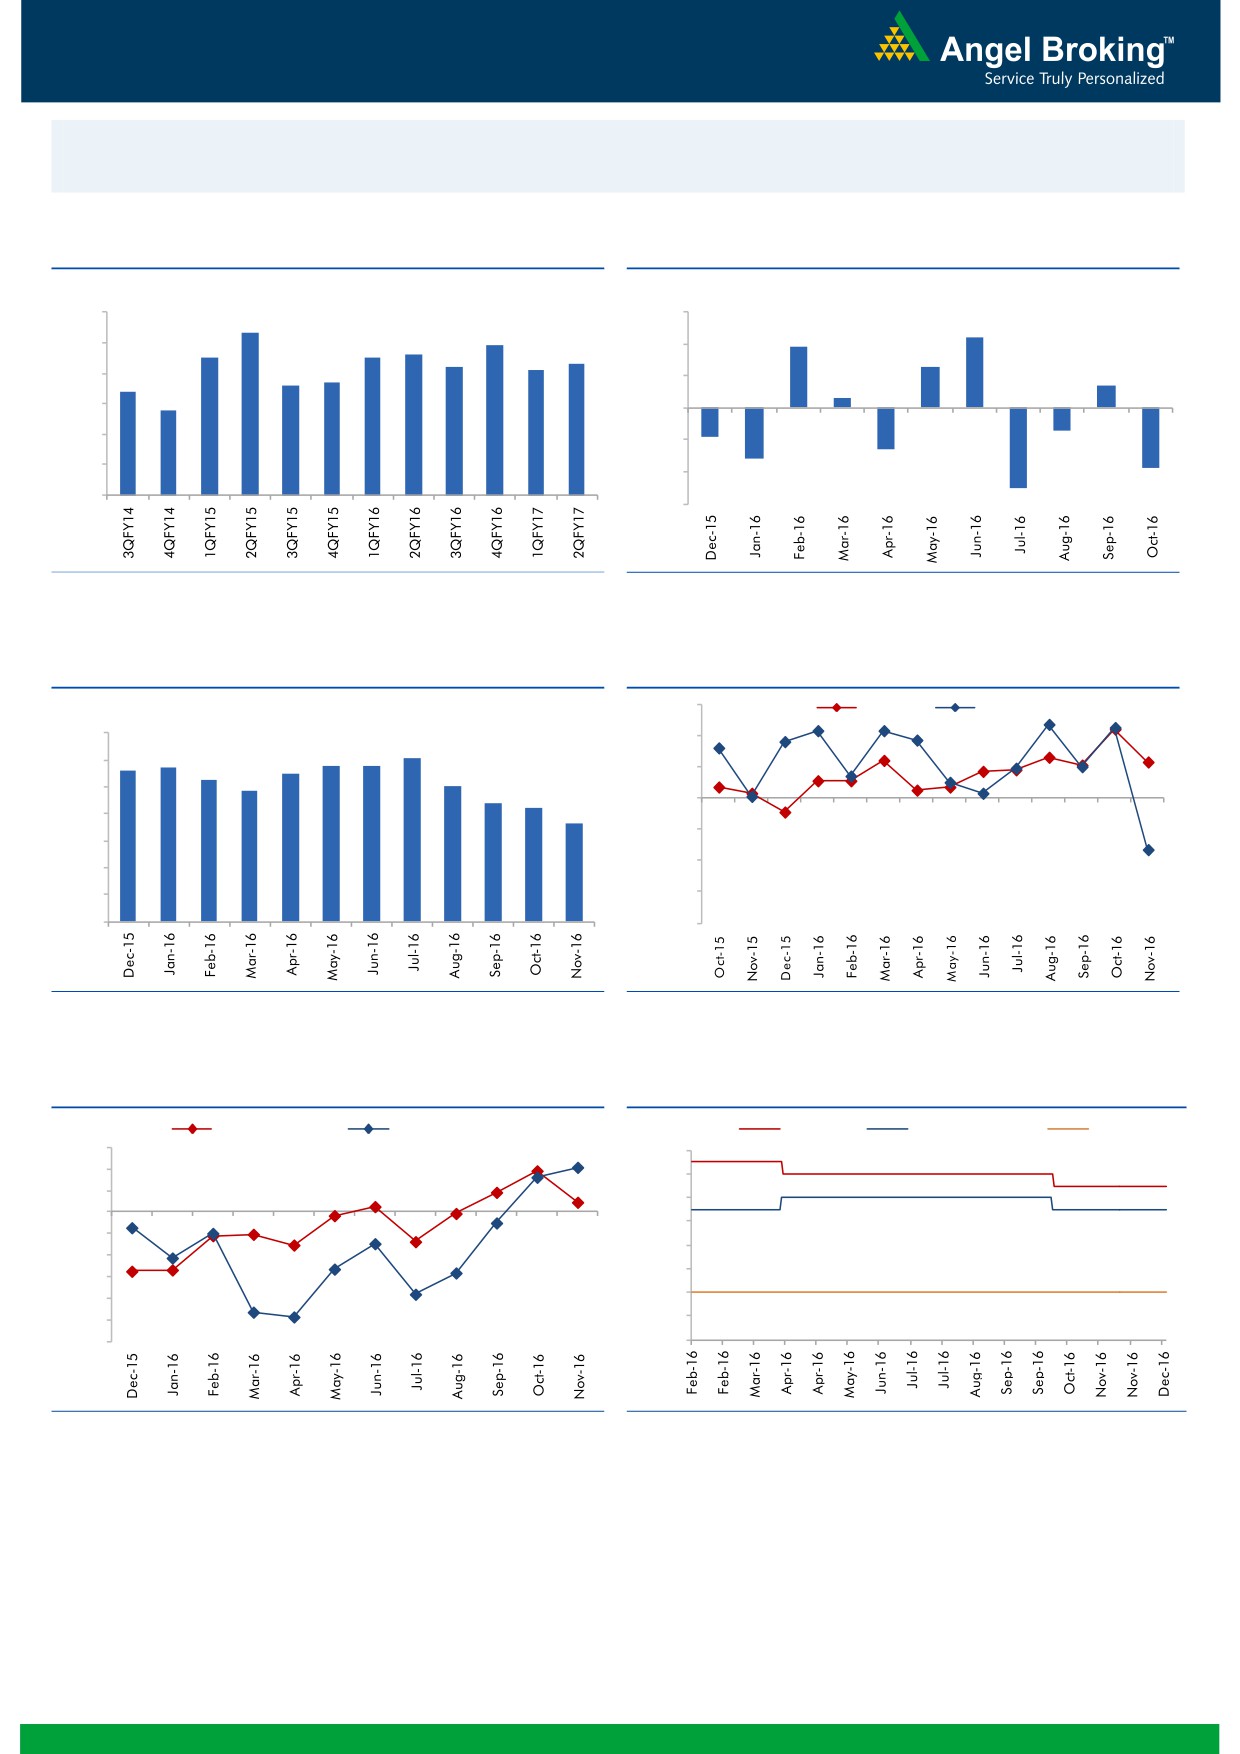
Macro watch
Exhibit 1: Quarterly GDP trends
Exhibit 2: IIP trends
(%)
(%)
9.0
3.0
8.3
2.2
7.9
1.9
7.5
7.5
7.6
8.0
7.3
2.0
7.2
7.1
1.3
6.6
6.7
0.7
7.0
6.4
1.0
0.3
5.8
6.0
-
5.0
(1.0)
(0.7)
(0.9)
4.0
(1.3)
(2.0)
(1.6)
(1.9)
3.0
(3.0)
(2.5)
Source: CSO, Angel Research
Source: MOSPI, Angel Research
Exhibit 3: Monthly CPI inflation trends
Exhibit 4: Manufacturing and services PMI
56.0
Mfg. PMI
Services PMI
(%)
7.0
54.0
6.1
5.6
5.7
5.8
5.8
6.0
5.3
5.5
5.1
52.0
4.8
5.0
4.4
4.2
50.0
3.6
4.0
48.0
3.0
46.0
2.0
1.0
44.0
-
42.0
Source: MOSPI, Angel Research
Source: Market, Angel Research; Note: Level above 50 indicates expansion
Exhibit 5: Exports and imports growth trends
Exhibit 6: Key policy rates
(%)
Exports yoy growth
Imports yoy growth
(%)
Repo rate
Reverse Repo rate
CRR
15.0
7.00
10.0
6.50
5.0
6.00
0.0
5.50
(5.0)
5.00
(10.0)
4.50
(15.0)
(20.0)
4.00
(25.0)
3.50
(30.0)
3.00
Source: Bloomberg, Angel Research
Source: RBI, Angel Research
Market Outlook
December 28, 2016
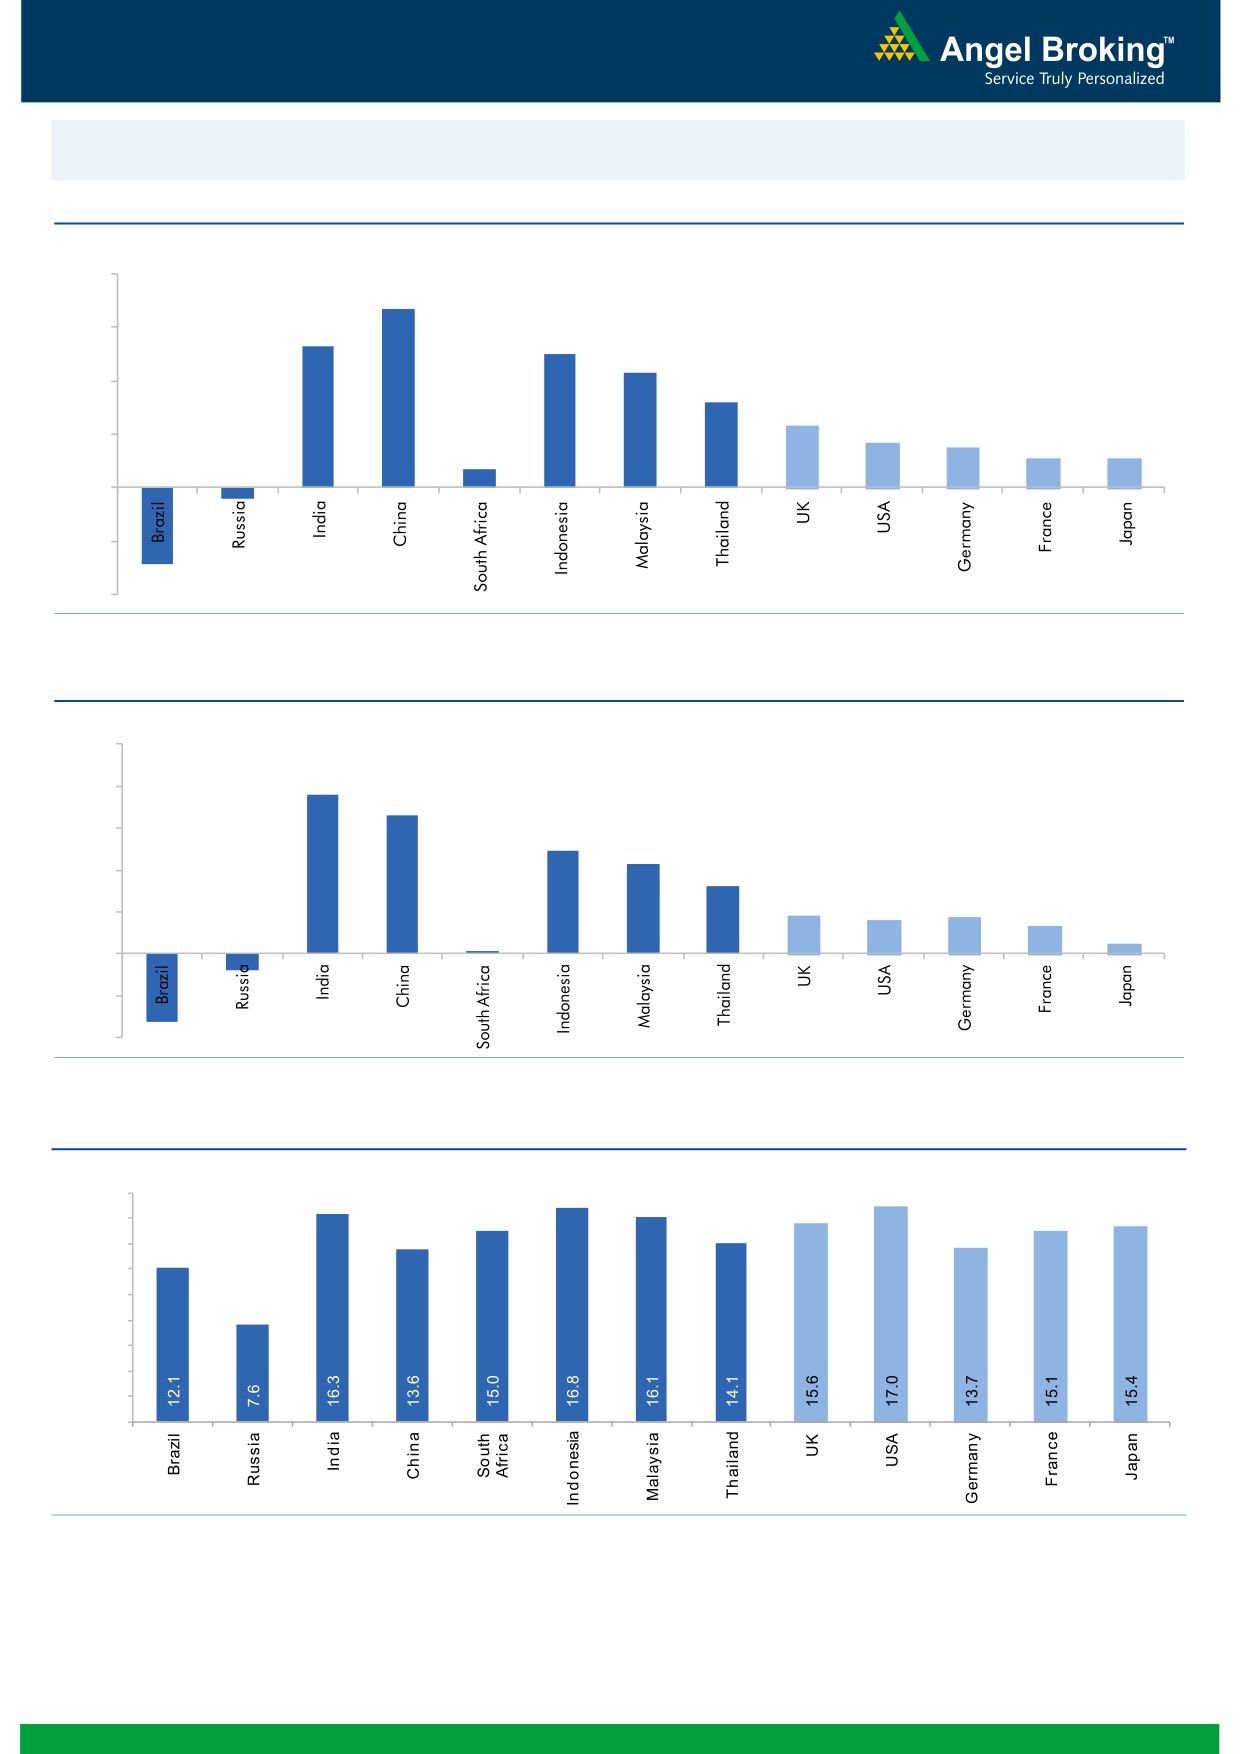
Global watch
Exhibit 1: Latest quarterly GDP Growth (%, yoy) across select developing and developed countries
(%)
8.0
6.7
5.3
6.0
5.0
0.7
4.3
4.0
3.2
2.3
1.7
1.5
2.0
1.1
1.1
-
(2.0)
(0.4)
(2.9)
(4.0)
Source: Bloomberg, Angel Research
Exhibit 2: 2016 GDP Growth projection by IMF (%, yoy) across select developing and developed countries
(%)
10.0
7.6
8.0
6.6
6.0
4.9
4.3
4.0
3.2
1.8
1.7
1.6
1.3
2.0
(0.8)
0.5
(3.3)
0.1
-
(2.0)
(4.0)
Source: IMF, Angel Research
Exhibit 3: One year forward P-E ratio across select developing and developed countries
(x)
18.0
16.0
14.0
12.0
10.0
8.0
6.0
4.0
2.0
-
Source: IMF, Angel Research
Market Outlook
December 28, 2016
Exhibit 4: Relative performance of indices across globe
Returns (%)
Country
Name of index
Closing price
1M
3M
1YR
Brazil
Bovespa
58,697
(4.5)
(0.6)
35.7
Russia
Micex
2,189
3.8
10.3
25.6
India
Nifty
8,033
(1.0)
(9.0)
2.5
China
Shanghai Composite
3,115
(4.5)
2.9
(13.0)
South Africa
Top 40
42,861
(3.8)
(5.7)
(6.6)
Mexico
Mexbol
45,300
(0.4)
(6.2)
3.7
Indonesia
LQ45
846
(3.2)
(8.6)
9.4
Malaysia
KLCI
1,620
(0.7)
(3.1)
(2.2)
Thailand
SET 50
946
1.4
(0.6)
13.6
USA
Dow Jones
19,945
4.8
9.2
13.7
UK
FTSE
7,068
3.7
3.7
12.7
Japan
Nikkei
19,403
5.8
15.4
1.9
Germany
DAX
11,472
7.2
10.2
11.4
France
CAC
4,848
6.5
10.0
8.0
Source: Bloomberg, Angel Research
Stock Watch
December 28, 2016
Company Name
Reco
CMP
Target
Mkt Cap
Sales ( Čcr )
OPM(%)
EPS (Č)
PER(x)
P/BV(x)
RoE(%)
EV/Sales(x)
(Č)
Price ( Č)
( Č cr )
FY17E FY18E
FY17E
FY18E
FY17E
FY18E
FY17E
FY18E
FY17E
FY18E
FY17E
FY18E
FY17E
FY18E
Agri / Agri Chemical
Rallis
Accumulate
191
209
3,720
1,937
2,164
13.3
14.3
9.0
11.0
21.3
17.4
3.7
3.2
18.4
19.8
2.0
1.7
United Phosphorus
Accumulate
636
684
32,247
15,176
17,604
18.5
18.5
37.4
44.6
17.0
14.3
3.3
2.8
21.4
21.2
2.2
1.9
Auto & Auto Ancillary
Ashok Leyland
Buy
78
111
22,184
22,407
26,022
10.6
10.6
5.2
6.4
14.9
12.1
3.4
2.9
23.6
24.7
1.1
0.9
Bajaj Auto
Neutral
2,634
-
76,208
25,093
27,891
19.5
19.2
143.9
162.5
18.3
16.2
5.1
4.4
30.3
29.4
2.8
2.4
Bharat Forge
Neutral
908
-
21,148
7,726
8,713
20.5
21.2
35.3
42.7
25.7
21.3
4.8
4.3
18.9
20.1
2.8
2.4
Eicher Motors
Neutral
20,701
-
56,314
16,583
20,447
17.5
18.0
598.0
745.2
34.6
27.8
11.8
9.0
41.2
38.3
3.2
2.6
Gabriel India
Buy
106
130
1,515
1,544
1,715
9.0
9.3
5.4
6.3
19.5
16.8
3.7
3.3
18.9
19.5
0.9
0.8
Hero Motocorp
Buy
3,034
3,541
60,586
30,958
34,139
15.7
15.7
193.6
208.3
15.7
14.6
6.1
5.1
34.2
30.5
1.8
1.6
Jamna Auto Industries Neutral
165
-
1,311
1,486
1,620
9.8
9.9
15.0
17.2
11.0
9.6
2.4
2.0
21.8
21.3
0.9
0.9
L G Balakrishnan & Bros Neutral
544
-
853
1,302
1,432
11.6
11.9
43.7
53.0
12.5
10.3
1.8
1.6
13.8
14.2
0.7
0.7
Mahindra and Mahindra Neutral
1,167
-
72,460
46,534
53,077
11.6
11.7
67.3
78.1
17.3
15.0
2.8
2.5
15.4
15.8
1.5
1.3
Maruti
Accumulate
5,227
6,006
157,894
68,057
82,958
15.8
15.5
212.1
261.2
24.6
20.0
4.9
4.1
19.8
20.3
2.0
1.6
Minda Industries
Neutral
294
-
2,330
2,728
3,042
9.0
9.1
68.2
86.2
4.3
3.4
1.0
0.8
23.8
24.3
0.9
0.8
Motherson Sumi
Neutral
310
-
43,449
45,896
53,687
7.8
8.3
13.0
16.1
23.7
19.2
7.7
6.1
34.7
35.4
1.0
0.9
Rane Brake Lining
Neutral
922
-
730
511
562
11.3
11.5
28.1
30.9
32.8
29.8
5.0
4.6
15.3
15.0
1.6
1.4
Setco Automotive
Neutral
35
-
463
741
837
13.0
13.0
15.2
17.0
2.3
2.0
0.4
0.3
15.8
16.3
1.0
0.9
Tata Motors
Neutral
467
-
134,688
300,209
338,549
8.9
8.4
42.7
54.3
10.9
8.6
1.8
1.5
15.6
17.2
0.6
0.5
TVS Motor
Neutral
352
-
16,742
13,390
15,948
6.9
7.1
12.8
16.5
27.6
21.3
6.9
5.4
26.3
27.2
1.3
1.1
Amara Raja Batteries
Buy
870
1,167
14,858
5,504
6,605
17.6
17.5
33.4
40.9
26.0
21.3
5.7
4.7
22.1
22.0
2.7
2.2
Exide Industries
Neutral
177
-
15,058
7,439
8,307
15.0
15.0
8.1
9.3
21.9
19.1
3.1
2.7
14.3
16.7
1.6
1.5
Apollo Tyres
Buy
188
235
9,565
12,877
14,504
14.3
13.9
21.4
23.0
8.8
8.2
1.4
1.2
16.4
15.2
0.9
0.8
Ceat
Buy
1,142
1,450
4,619
7,524
8,624
13.0
12.7
131.1
144.3
8.7
7.9
1.6
1.4
19.8
18.6
0.7
0.6
JK Tyres
Neutral
110
-
2,489
7,455
8,056
15.0
15.0
21.8
24.5
5.0
4.5
1.1
0.9
22.8
21.3
0.5
0.4
Swaraj Engines
Neutral
1,312
-
1,629
660
810
15.2
16.4
54.5
72.8
24.1
18.0
7.5
6.8
31.5
39.2
2.3
1.8
Subros
Neutral
152
-
912
1,488
1,681
11.7
11.9
6.4
7.2
23.8
21.2
2.5
2.3
10.8
11.4
0.8
0.7
Indag Rubber
Neutral
178
-
468
286
326
19.8
16.8
11.7
13.3
15.2
13.4
2.6
2.4
17.8
17.1
1.3
1.1
Capital Goods
ACE
Neutral
45
-
442
709
814
4.1
4.6
1.4
2.1
31.9
21.3
1.3
1.2
4.4
6.0
0.8
0.7
BEML
Neutral
977
-
4,068
3,451
4,055
6.3
9.2
31.4
57.9
31.1
16.9
1.9
1.7
6.3
10.9
1.3
1.1
Bharat Electronics
Neutral
1,372
-
30,649
8,137
9,169
16.8
17.2
58.7
62.5
23.4
22.0
3.6
3.2
44.6
46.3
2.7
2.5
Stock Watch
December 28, 2016
Company Name
Reco
CMP
Target
Mkt Cap
Sales ( Čcr )
OPM(%)
EPS (Č)
PER(x)
P/BV(x)
RoE(%)
EV/Sales(x)
(Č)
Price ( Č)
( Č cr )
FY17E
FY18E
FY17E
FY18E
FY17E
FY18E
FY17E
FY18E
FY17E
FY18E
FY17E
FY18E
FY17E
FY18E
Capital Goods
Voltas
Buy
317
407
10,501
6,511
7,514
7.9
8.7
12.9
16.3
24.6
19.5
4.4
3.9
16.7
18.5
1.4
1.2
BGR Energy
Neutral
108
-
780
16,567
33,848
6.0
5.6
7.8
5.9
13.9
18.3
0.8
0.8
4.7
4.2
0.1
0.1
BHEL
Neutral
119
-
29,200
28,797
34,742
-
2.8
2.3
6.9
51.9
17.3
0.9
0.9
1.3
4.8
0.7
0.4
Blue Star
Buy
448
634
4,278
4,283
5,077
5.9
7.3
14.9
22.1
30.1
20.2
5.8
4.9
20.4
26.4
1.0
0.9
Crompton Greaves
Neutral
57
-
3,572
5,777
6,120
5.9
7.0
3.3
4.5
17.3
12.7
0.8
0.7
4.4
5.9
0.6
0.5
Greaves Cotton
Neutral
119
-
2,894
1,755
1,881
16.8
16.9
7.8
8.5
15.2
13.9
3.0
2.8
20.6
20.9
1.3
1.2
Inox Wind
Neutral
185
-
4,098
5,605
6,267
15.7
16.4
24.8
30.0
7.5
6.2
2.1
1.5
25.9
24.4
0.8
0.6
KEC International
Neutral
134
-
3,453
9,294
10,186
7.9
8.1
9.9
11.9
13.6
11.3
2.0
1.7
15.6
16.3
0.6
0.5
Thermax
Neutral
756
-
9,009
5,421
5,940
7.3
7.3
25.7
30.2
29.4
25.0
3.6
3.3
12.2
13.1
1.5
1.4
VATech Wabag
Buy
460
681
2,509
3,136
3,845
8.9
9.1
26.0
35.9
17.7
12.8
2.2
1.9
13.4
15.9
0.7
0.6
Cement
ACC
Neutral
1,295
-
24,317
11,225
13,172
13.2
16.9
44.5
75.5
29.1
17.2
2.8
2.5
11.2
14.2
2.2
1.9
Ambuja Cements
Neutral
203
-
40,249
9,350
10,979
18.2
22.5
5.8
9.5
35.0
21.3
2.9
2.6
10.2
12.5
4.3
3.7
India Cements
Neutral
111
-
3,420
4,364
4,997
18.5
19.2
7.9
11.3
14.1
9.9
1.0
1.0
8.0
8.5
1.5
1.3
JK Cement
Neutral
643
-
4,493
4,398
5,173
15.5
17.5
31.2
55.5
20.6
11.6
2.5
2.1
12.0
15.5
1.6
1.3
J K Lakshmi Cement
Buy
352
565
4,146
2,913
3,412
14.5
19.5
7.5
22.5
47.0
15.7
2.9
2.4
12.5
18.0
2.0
1.7
Orient Cement
Buy
129
215
2,637
2,114
2,558
18.5
20.5
8.1
11.3
15.9
11.4
2.3
2.0
9.0
14.0
1.9
1.5
UltraTech Cement
Neutral
3,157
-
86,646
25,768
30,385
21.0
23.5
111.0
160.0
28.4
19.7
3.6
3.2
13.5
15.8
3.5
2.9
Construction
ITNL
Neutral
99
-
3,270
8,946
10,017
31.0
31.6
8.1
9.1
12.3
10.9
0.5
0.5
4.2
5.0
3.7
3.4
KNR Constructions
Neutral
153
-
2,157
1,385
1,673
14.7
14.0
41.2
48.5
3.7
3.2
0.7
0.6
14.9
15.2
1.6
1.4
Larsen & Toubro
Buy
1,354
1,634
126,326
111,017
124,908
11.0
11.0
61.1
66.7
22.2
20.3
2.7
2.5
13.1
12.9
2.2
2.0
Gujarat Pipavav Port
Neutral
131
-
6,340
705
788
52.2
51.7
5.0
5.6
26.2
23.4
2.6
2.3
11.2
11.2
8.6
7.2
Nagarjuna Const.
Neutral
77
-
4,270
8,842
9,775
9.1
8.8
5.3
6.4
14.5
12.0
1.2
1.1
8.2
9.1
0.6
0.6
PNC Infratech
Buy
101
143
2,601
2,350
2,904
13.1
13.2
9.0
8.8
11.3
11.5
0.4
0.4
15.9
13.9
1.2
1.0
Simplex Infra
Neutral
268
-
1,327
6,829
7,954
10.5
10.5
31.4
37.4
8.5
7.2
0.9
0.8
9.9
13.4
0.6
0.5
Power Mech Projects
Neutral
445
-
655
1,801
2,219
12.7
14.6
72.1
113.9
6.2
3.9
1.1
1.0
16.8
11.9
0.4
0.3
Sadbhav Engineering
Accumulate
263
298
4,511
3,598
4,140
10.3
10.6
9.0
11.9
29.2
22.1
3.1
2.7
9.9
11.9
1.5
1.3
NBCC
Neutral
225
-
13,500
7,428
9,549
7.9
8.6
8.2
11.0
27.4
20.5
1.4
1.1
28.2
28.7
1.5
1.1
MEP Infra
Neutral
35
-
574
1,877
1,943
30.6
29.8
3.0
4.2
11.8
8.4
5.7
3.8
0.6
0.6
1.7
1.5
SIPL
Neutral
91
-
3,196
1,036
1,252
65.5
66.2
(8.4)
(5.6)
3.4
3.9
(22.8)
(15.9)
11.3
9.4
Stock Watch
December 28, 2016
Company Name
Reco
CMP
Target
Mkt Cap
Sales ( Čcr )
OPM(%)
EPS (Č)
PER(x)
P/BV(x)
RoE(%)
EV/Sales(x)
(Č)
Price ( Č)
( Č cr )
FY17E
FY18E
FY17E
FY18E
FY17E
FY18E
FY17E
FY18E
FY17E
FY18E
FY17E
FY18E
FY17E
FY18E
Construction
Engineers India
Neutral
319
-
10,743
1,725
1,935
16.0
19.1
11.4
13.9
28.0
22.9
3.9
3.7
13.4
15.3
5.2
4.6
Financials
Axis Bank
Buy
437
630
104,607
46,932
53,575
3.5
3.4
32.4
44.6
13.5
9.8
1.7
1.5
13.6
16.5
-
-
Bank of Baroda
Neutral
150
-
34,528
19,980
23,178
1.8
1.8
11.5
17.3
13.0
8.7
1.5
1.2
8.3
10.1
-
-
Canara Bank
Neutral
268
-
14,533
15,225
16,836
1.8
1.8
14.5
28.0
18.5
9.6
1.3
1.0
5.8
8.5
-
-
Dewan Housing Finance Buy
239
350
7,471
2,225
2,688
2.9
2.9
29.7
34.6
8.0
6.9
1.3
1.1
16.1
16.8
-
-
Equitas Holdings
Buy
142
235
4,752
939
1,281
11.7
11.5
5.8
8.2
24.4
17.3
2.1
1.9
10.9
11.5
-
-
Federal Bank
Neutral
64
-
11,089
9,353
10,623
2.9
2.9
4.4
5.8
14.7
11.1
1.4
1.2
9.5
11.0
-
-
HDFC
Neutral
1,232
-
195,228
11,475
13,450
3.4
3.4
45.3
52.5
27.2
23.5
5.2
4.6
20.2
20.5
-
-
HDFC Bank
Accumulate
1,185
1,350
302,632
46,097
55,433
4.5
4.5
58.4
68.0
20.3
17.4
3.6
3.0
18.8
18.6
-
-
ICICI Bank
Buy
253
315
147,433
42,800
44,686
3.1
3.3
18.0
21.9
14.1
11.6
1.9
1.8
11.1
12.3
-
-
Lakshmi Vilas Bank
Buy
139
174
2,486
3,339
3,799
2.7
2.8
11.0
14.0
12.6
9.9
1.3
1.2
11.2
12.7
-
-
LIC Housing Finance
Buy
540
630
27,227
3,712
4,293
2.6
2.5
39.0
46.0
13.8
11.7
2.6
2.2
19.9
20.1
-
-
Punjab Natl.Bank
Neutral
116
-
24,706
23,532
23,595
2.3
2.4
6.8
12.6
17.1
9.2
2.6
1.9
3.3
6.5
-
-
RBL Bank
Neutral
330
-
12,215
1,783
2,309
2.6
2.6
12.7
16.4
26.0
20.1
2.8
2.5
12.8
13.3
-
-
South Ind.Bank
Neutral
19
-
2,602
6,435
7,578
2.5
2.5
2.7
3.1
7.1
6.2
0.9
0.8
10.1
11.2
-
-
St Bk of India
Neutral
249
-
193,060
88,650
98,335
2.6
2.6
13.5
18.8
18.4
13.2
1.8
1.5
7.0
8.5
-
-
Union Bank
Neutral
124
-
8,521
13,450
14,925
2.3
2.3
25.5
34.5
4.9
3.6
0.7
0.6
7.5
10.2
-
-
Yes Bank
Neutral
1,126
-
47,622
8,978
11,281
3.3
3.4
74.0
90.0
15.2
12.5
2.9
2.5
17.0
17.2
-
-
FMCG
Asian Paints
Neutral
876
-
84,059
17,128
18,978
16.8
16.4
19.1
20.7
45.9
42.3
16.0
15.1
34.8
35.5
4.8
4.4
Britannia
Buy
2,823
3,626
33,876
9,594
11,011
14.6
14.9
80.3
94.0
35.2
30.0
14.5
11.2
41.2
-
3.4
2.9
Colgate
Accumulate
886
995
24,094
4,605
5,149
23.4
23.4
23.8
26.9
37.2
32.9
20.6
16.1
64.8
66.8
5.2
4.6
Dabur India
Accumulate
270
304
47,587
8,315
9,405
19.8
20.7
8.1
9.2
33.4
29.4
9.3
7.7
31.6
31.0
5.4
4.7
GlaxoSmith Con*
Neutral
4,989
-
20,983
4,350
4,823
21.2
21.4
179.2
196.5
27.8
25.4
7.4
6.3
27.1
26.8
4.2
3.7
Godrej Consumer
Neutral
1,456
-
49,586
10,235
11,428
18.4
18.6
41.1
44.2
35.4
32.9
7.9
6.6
24.9
24.8
4.9
4.4
HUL
Neutral
806
-
174,527
35,252
38,495
17.8
17.8
20.7
22.4
39.1
36.0
37.3
32.0
95.6
88.9
4.8
4.4
ITC
Buy
234
284
283,715
40,059
44,439
38.3
39.2
9.0
10.1
26.1
23.1
7.3
6.4
27.8
27.5
6.6
5.9
Marico
Buy
246
300
31,754
6,430
7,349
18.8
19.5
6.4
7.7
38.5
32.0
11.6
9.8
33.2
32.5
4.8
4.1
Nestle*
Neutral
5,886
-
56,751
10,073
11,807
20.7
21.5
124.8
154.2
47.2
38.2
19.4
17.4
34.8
36.7
5.4
4.6
Tata Global
Neutral
121
-
7,608
8,675
9,088
9.8
9.8
7.4
8.2
16.3
14.7
1.9
1.8
7.9
8.1
0.8
0.7
Stock Watch
December 28, 2016
Company Name
Reco
CMP
Target
Mkt Cap
Sales ( Čcr )
OPM(%)
EPS (Č)
PER(x)
P/BV(x)
RoE(%)
EV/Sales(x)
(Č)
Price ( Č)
( Č cr )
FY17E FY18E
FY17E
FY18E
FY17E
FY18E
FY17E
FY18E
FY17E
FY18E
FY17E
FY18E
FY17E
FY18E
FMCG
Procter & Gamble
Neutral
7,019
-
22,784
2,939
3,342
23.2
23.0
146.2
163.7
48.0
42.9
107.5
103.1
25.3
23.5
7.3
6.3
Hygiene
IT
HCL Tech^
Buy
803
1,000
113,330
49,242
57,168
20.5
20.5
55.7
64.1
14.4
12.5
2.9
2.2
20.3
17.9
2.2
1.8
Infosys
Buy
999
1,249
229,522
68,350
77,326
27.0
27.0
62.5
69.4
16.0
14.4
3.4
3.1
21.3
21.6
2.8
2.4
TCS
Accumulate
2,322
2,620
457,504
119,025
133,308
27.6
27.6
131.2
145.5
17.7
16.0
5.7
5.3
32.4
33.1
3.6
3.2
Tech Mahindra
Buy
469
600
45,631
29,673
32,937
15.5
17.0
32.8
39.9
14.3
11.8
2.8
2.4
19.6
20.7
1.3
1.1
Wipro
Buy
464
590
112,793
55,440
60,430
18.1
18.1
35.9
39.9
12.9
11.6
2.3
2.1
19.0
19.3
1.7
1.6
Media
D B Corp
Neutral
360
-
6,623
2,297
2,590
27.4
28.2
21.0
23.4
17.2
15.4
4.0
3.5
23.7
23.1
2.7
2.3
HT Media
Neutral
72
-
1,677
2,693
2,991
12.6
12.9
7.9
9.0
9.1
8.0
0.8
0.7
7.8
8.3
0.2
0.1
Jagran Prakashan
Buy
166
225
5,412
2,355
2,635
28.0
28.0
10.8
12.5
15.3
13.3
3.3
2.9
21.7
21.7
2.3
2.0
Sun TV Network
Neutral
483
-
19,022
2,850
3,265
70.1
71.0
26.2
30.4
18.4
15.9
4.7
4.2
24.3
25.6
6.3
5.3
Hindustan Media
Neutral
264
-
1,938
1,016
1,138
24.3
25.2
27.3
30.1
9.7
8.8
1.8
1.6
16.2
15.8
1.2
1.1
Ventures
TV Today Network
Buy
258
385
1,538
637
743
27.5
27.5
18.4
21.4
14.0
12.1
2.4
2.1
17.4
17.2
2.0
1.6
Metals & Mining
Coal India
Neutral
289
-
179,611
84,638
94,297
21.4
22.3
24.5
27.1
11.8
10.7
4.9
4.7
42.6
46.0
1.6
1.5
Hind. Zinc
Neutral
252
-
106,563
14,252
18,465
55.9
48.3
15.8
21.5
16.0
11.7
2.6
2.3
17.0
20.7
7.5
5.8
Hindalco
Neutral
156
-
32,139
107,899
112,095
7.4
8.2
9.2
13.0
16.9
12.0
0.8
0.8
4.8
6.6
0.8
0.8
JSW Steel
Neutral
1,580
-
38,184
53,201
58,779
16.1
16.2
130.6
153.7
12.1
10.3
1.6
1.4
14.0
14.4
1.5
1.3
NMDC
Neutral
122
-
38,457
6,643
7,284
44.4
47.7
7.1
7.7
17.1
15.8
1.5
1.4
8.8
9.2
3.6
3.2
SAIL
Neutral
49
-
20,072
47,528
53,738
(0.7)
2.1
(1.9)
2.6
18.7
0.5
0.5
(1.6)
3.9
1.3
1.2
Vedanta
Neutral
215
-
63,637
71,744
81,944
19.2
21.7
13.4
20.1
16.0
10.7
1.4
1.2
8.4
11.3
1.3
1.0
Tata Steel
Neutral
393
-
38,144
121,374
121,856
7.2
8.4
18.6
34.3
21.1
11.5
1.3
1.2
6.1
10.1
1.0
0.9
Oil & Gas
Cairn India
Neutral
242
-
45,433
9,127
10,632
4.3
20.6
8.8
11.7
27.5
20.7
0.9
0.9
3.3
4.2
6.4
5.4
GAIL
Neutral
425
-
53,860
56,220
65,198
9.3
10.1
27.1
33.3
15.7
12.8
1.4
1.3
9.3
10.7
1.1
1.0
ONGC
Neutral
191
-
244,473
137,222
152,563
15.0
21.8
19.5
24.1
9.8
7.9
0.8
0.8
8.5
10.1
2.1
1.8
Indian Oil Corp
Neutral
317
-
154,078
373,359
428,656
5.9
5.5
54.0
59.3
5.9
5.4
0.9
0.8
16.0
15.6
0.6
0.5
Reliance Industries
Neutral
1,064
-
345,248
301,963
358,039
12.1
12.6
87.7
101.7
12.1
10.5
1.2
1.1
10.7
11.3
1.6
1.3
Pharmaceuticals
Alembic Pharma
Neutral
606
-
11,426
3,483
4,083
20.2
21.4
24.3
30.4
24.9
19.9
5.7
4.5
25.5
25.3
3.2
2.7
Alkem Laboratories Ltd
Buy
1,608
1,989
19,221
6,043
6,893
18.7
19.3
80.5
88.8
20.0
18.1
4.5
3.7
22.3
20.3
3.1
2.7
Aurobindo Pharma
Buy
645
877
37,767
15,720
18,078
23.7
23.7
41.4
47.3
15.6
13.6
4.1
3.2
29.6
26.1
2.6
2.3
Sanofi India*
Neutral
4,220
-
9,719
2,277
2,597
17.3
18.3
149.4
172.0
28.3
24.5
4.7
3.8
25.1
28.8
3.9
3.2
Stock Watch
December 28, 2016
Company Name
Reco
CMP
Target
Mkt Cap
Sales ( Čcr )
OPM(%)
EPS (Č)
PER(x)
P/BV(x)
RoE(%)
EV/Sales(x)
(Č)
Price ( Č)
( Č cr )
FY17E FY18E
FY17E
FY18E
FY17E
FY18E
FY17E
FY18E
FY17E
FY18E
FY17E
FY18E
FY17E
FY18E
Pharmaceuticals
Cadila Healthcare
Accumulate
350
400
35,805
10,429
12,318
22.6
22.0
16.9
19.2
20.7
18.2
5.3
4.2
28.5
25.7
3.4
2.8
Cipla
Reduce
563
490
45,272
15,378
18,089
17.4
18.4
21.6
27.2
26.1
20.7
3.4
2.9
13.7
15.2
3.1
2.6
Dr Reddy's
Neutral
3,036
-
50,288
16,043
18,119
20.8
22.4
112.4
142.9
27.0
21.2
3.6
3.2
14.1
15.9
3.1
2.7
Dishman Pharma
Neutral
208
-
3,359
1,718
1,890
22.7
22.8
9.5
11.3
21.9
18.4
2.1
1.9
10.1
10.9
2.4
2.1
GSK Pharma*
Neutral
2,702
-
22,883
3,000
3,312
15.4
20.6
46.5
60.8
58.1
44.4
14.0
13.9
26.3
30.6
7.4
6.7
Indoco Remedies
Neutral
252
-
2,322
1,112
1,289
16.2
18.2
11.6
16.0
21.7
15.8
3.5
2.9
17.0
20.1
2.2
1.9
Ipca labs
Buy
514
613
6,488
3,303
3,799
15.3
15.3
17.3
19.7
29.7
26.1
2.6
2.4
9.1
9.4
2.1
1.8
Lupin
Buy
1,443
1,809
65,143
15,912
18,644
26.4
26.7
58.1
69.3
24.8
20.8
4.8
4.0
21.4
20.9
4.2
3.4
Sun Pharma
Buy
620
847
148,847
31,129
35,258
32.0
32.9
30.2
35.3
20.5
17.6
3.4
2.8
20.0
20.1
4.4
3.7
Power
Tata Power
Neutral
74
-
19,906
36,916
39,557
17.4
27.1
5.1
6.3
14.4
11.7
1.3
1.2
9.0
10.3
1.6
1.4
NTPC
Neutral
160
-
131,969
86,605
95,545
17.5
20.8
11.8
13.4
13.6
11.9
1.4
1.3
10.5
11.1
2.9
2.9
Power Grid
Buy
181
223
94,744
25,315
29,193
88.2
88.7
14.2
17.2
12.8
10.6
1.9
1.7
15.2
16.1
8.4
7.6
Real Estate
MLIFE
Buy
347
522
1,423
1,152
1,300
22.7
24.6
29.9
35.8
11.6
9.7
0.9
0.8
7.6
8.6
2.0
1.6
Telecom
Bharti Airtel
Neutral
299
-
119,682
105,086
114,808
34.5
34.7
12.2
16.4
24.5
18.3
1.7
1.6
6.8
8.4
2.0
1.8
Idea Cellular
Neutral
70
-
25,263
40,133
43,731
37.2
37.1
6.4
6.5
11.0
10.8
0.9
0.9
8.2
7.6
1.6
1.4
zOthers
Abbott India
Neutral
4,540
-
9,647
3,153
3,583
14.1
14.4
152.2
182.7
29.8
24.9
146.5
125.1
25.6
26.1
2.8
2.4
Bajaj Electricals
Buy
209
274
2,120
4,801
5,351
5.7
6.2
10.4
13.7
20.1
15.3
2.5
2.2
12.4
14.5
0.4
0.4
Finolex Cables
Neutral
419
-
6,404
2,883
3,115
12.0
12.1
14.2
18.6
29.5
22.5
15.7
13.7
15.8
14.6
1.9
1.7
Goodyear India*
Neutral
652
-
1,503
1,598
1,704
10.4
10.2
49.4
52.6
13.2
12.4
60.9
53.4
18.2
17.0
0.6
85.6
Hitachi
Neutral
1,394
-
3,790
2,081
2,433
8.8
8.9
33.4
39.9
41.7
34.9
33.7
28.1
22.1
21.4
1.8
1.5
Jyothy Laboratories
Neutral
334
-
6,058
1,440
2,052
11.5
13.0
8.5
10.0
39.2
33.4
9.5
8.8
18.6
19.3
4.5
3.1
Page Industries
Neutral
12,897
-
14,385
2,450
3,124
20.1
17.6
299.0
310.0
43.1
41.6
287.2
219.3
47.1
87.5
5.9
4.7
Relaxo Footwears
Neutral
402
-
4,824
2,085
2,469
9.2
8.2
7.6
8.0
53.1
50.5
20.6
17.6
17.9
18.8
2.4
2.1
Siyaram Silk Mills
Accumulate
1,200
1,605
1,125
1,733
1,948
11.6
11.7
96.6
114.7
12.4
10.5
1.9
1.6
15.3
15.7
0.9
0.8
Styrolution ABS India*
Neutral
586
-
1,031
1,440
1,537
9.2
9.0
40.6
42.6
14.4
13.8
36.9
33.5
12.3
11.6
0.7
0.6
TVS Srichakra
Neutral
3,199
-
2,450
2,304
2,614
13.7
13.8
231.1
266.6
13.8
12.0
359.5
283.0
33.9
29.3
1.1
0.9
HSIL
Neutral
279
-
2,019
2,384
2,515
15.8
16.3
15.3
19.4
18.3
14.4
18.1
15.6
7.8
9.3
1.0
0.9
Kirloskar Engines India
Neutral
327
-
4,725
2,554
2,800
9.9
10.0
10.5
12.1
31.1
27.0
13.0
12.3
10.7
11.7
1.5
1.3
Ltd
M M Forgings
Neutral
413
-
498
546
608
20.4
20.7
41.3
48.7
10.0
8.5
56.5
50.0
16.6
17.0
0.8
0.7
Stock Watch
December 28, 2016
Company Name
Reco
CMP
Target
Mkt Cap
Sales ( Čcr )
OPM(%)
EPS (Č)
PER(x)
P/BV(x)
RoE(%)
EV/Sales(x)
(Č)
Price ( Č)
( Č cr )
FY17E
FY18E
FY17E
FY18E
FY17E
FY18E
FY17E
FY18E
FY17E
FY18E
FY17E
FY18E
FY17E
FY18E
zOthers
Banco Products (India) Neutral
172
-
1,232
1,353
1,471
12.3
12.4
14.5
16.3
11.9
10.6
16.4
14.8
14.5
14.6
0.9
90.8
Competent Automobiles Neutral
155
-
95
1,137
1,256
3.1
2.7
28.0
23.6
5.5
6.6
29.8
26.9
14.3
11.5
0.1
0.1
Nilkamal
Neutral
1,253
-
1,870
1,995
2,165
10.7
10.4
69.8
80.6
18.0
15.5
71.6
62.2
16.6
16.5
0.9
0.8
Visaka Industries
Neutral
180
-
286
1,051
1,138
10.3
10.4
21.0
23.1
8.6
7.8
23.1
21.6
9.0
9.2
0.5
0.5
Transport Corporation of
Neutral
154
-
1,179
2,671
2,911
8.5
8.8
13.9
15.7
11.1
9.8
1.5
1.4
13.7
13.8
0.5
0.5
India
Elecon Engineering
Neutral
55
-
619
1,482
1,660
13.7
14.5
3.9
5.8
14.2
9.5
3.3
3.1
7.8
10.9
0.7
0.7
Surya Roshni
Neutral
171
-
750
3,342
3,625
7.8
7.5
17.3
19.8
9.9
8.7
18.8
15.1
10.5
10.8
0.5
0.4
MT Educare
Neutral
113
-
451
366
417
17.7
18.2
9.4
10.8
12.1
10.5
2.7
2.3
22.2
22.3
1.1
1.0
Radico Khaitan
Buy
111
147
1,482
1,667
1,824
13.0
13.2
6.7
8.2
16.8
13.6
1.5
1.4
9.0
10.2
1.3
1.1
Garware Wall Ropes
Neutral
601
-
1,316
873
938
14.3
14.3
35.2
37.5
17.1
16.0
3.0
2.6
17.5
15.9
1.4
1.3
Wonderla Holidays
Neutral
343
-
1,940
287
355
38.0
40.0
11.3
14.2
30.4
24.2
4.4
3.8
21.4
23.9
6.4
5.2
Linc Pen & Plastics
Neutral
239
-
353
382
420
9.3
9.5
13.5
15.7
17.7
15.2
3.0
2.6
17.1
17.3
1.0
0.9
The Byke Hospitality
Neutral
162
-
651
287
384
20.5
20.5
7.6
10.7
21.4
15.2
4.5
3.6
20.7
23.5
2.3
1.7
Interglobe Aviation
Neutral
830
-
30,011
21,122
26,005
14.5
27.6
110.7
132.1
7.5
6.3
44.9
32.1
168.5
201.1
1.4
1.1
Coffee Day Enterprises
Neutral
192
-
3,961
2,964
3,260
20.5
21.2
4.7
8.0
-
24.0
2.2
2.0
5.5
8.5
1.7
1.5
Ltd
Navneet Education
Neutral
109
-
2,605
1,062
1,147
24.0
24.0
6.1
6.6
18.0
16.5
3.7
3.3
20.6
19.8
2.5
2.3
Navkar Corporation
Buy
160
265
2,281
369
561
42.9
42.3
7.2
11.5
22.2
13.9
1.6
1.5
7.4
10.5
7.2
4.7
UFO Moviez
Neutral
403
-
1,112
619
685
33.2
33.4
30.0
34.9
13.5
11.6
1.9
1.6
13.8
13.9
1.5
1.2
VRL Logistics
Neutral
260
-
2,373
1,902
2,119
16.7
16.6
14.6
16.8
17.9
15.5
3.9
3.4
21.9
22.2
1.4
1.2
Team Lease Serv.
Neutral
870
-
1,488
3,229
4,001
1.5
1.8
22.8
32.8
38.2
26.5
4.1
3.6
10.7
13.4
0.4
0.3
S H Kelkar & Co.
Neutral
296
-
4,286
1,036
1,160
15.1
15.0
6.1
7.2
48.5
41.3
5.2
4.8
10.7
11.5
4.0
3.5
Quick Heal
Neutral
248
-
1,735
408
495
27.3
27.0
7.7
8.8
32.0
28.2
3.0
3.0
9.3
10.6
3.4
2.8
Narayana Hrudaya
Neutral
339
-
6,925
1,873
2,166
11.5
11.7
2.6
4.0
128.1
85.5
7.9
7.1
6.1
8.3
3.8
3.3
Manpasand Bever.
Neutral
519
-
2,970
836
1,087
19.6
19.4
16.9
23.8
30.7
21.8
3.7
3.2
12.0
14.8
3.3
2.4
Parag Milk Foods
Neutral
259
-
2,175
1,919
2,231
9.3
9.6
9.5
12.9
27.4
20.0
4.3
3.5
15.5
17.5
1.3
1.1
Mirza International
Buy
83
107
993
987
1,106
18.0
18.0
6.5
7.6
12.6
10.8
2.0
1.7
15.9
15.7
1.2
1.1
Asian Granito
Buy
212
351
638
1,071
1,182
12.1
12.4
12.7
16.0
16.7
13.3
1.6
1.4
9.5
10.7
0.9
0.8
Source: Company, Angel Research; Note: *December year end; #September year end; &October year end; Price as on December 27, 2016
Market Outlook
December 28, 2016
Research Team Tel: 022 - 39357800
DISCLAIMER
Angel Broking Private Limited (hereinafter referred to as “Angel”) is a registered Member of National Stock Exchange of India
Limited,Bombay Stock Exchange Limited and Metropolitan Stock Exchange Limited. It is also registered as a Depository Participant with
CDSL and Portfolio Manager with SEBI. It also has registration with AMFI as a Mutual Fund Distributor. Angel Broking Private Limited is a
registered entity with SEBI for Research Analyst in terms of SEBI (Research Analyst) Regulations, 2014 vide registration number
INH000000164. Angel or its associates has not been debarred/ suspended by SEBI or any other regulatory authority for accessing
/dealing in securities Market. Angel or its associates/analyst has not received any compensation / managed or
co-managed public offering of securities of the company covered by Analyst during the past twelve months.
This document is solely for the personal information of the recipient, and must not be singularly used as the basis of any investment
decision. Nothing in this document should be construed as investment or financial advice. Each recipient of this document should make
such investigations as they deem necessary to arrive at an independent evaluation of an investment in the securities of the companies
referred to in this document (including the merits and risks involved), and should consult their own advisors to determine the merits and
risks of such an investment.
Reports based on technical and derivative analysis center on studying charts of a stock's price movement, outstanding positions and
trading volume, as opposed to focusing on a company's fundamentals and, as such, may not match with a report on a company's
fundamentals. Investors are advised to refer the Fundamental and Technical Research Reports available on our website to evaluate the
contrary view, if any.
The information in this document has been printed on the basis of publicly available information, internal data and other reliable
sources believed to be true, but we do not represent that it is accurate or complete and it should not be relied on as such, as this
document is for general guidance only. Angel Broking Pvt. Limited or any of its affiliates/ group companies shall not be in any way
responsible for any loss or damage that may arise to any person from any inadvertent error in the information contained in this report.
Angel Broking Pvt. Limited has not independently verified all the information contained within this document. Accordingly, we cannot
testify, nor make any representation or warranty, express or implied, to the accuracy, contents or data contained within this document.
While Angel Broking Pvt. Limited endeavors to update on a reasonable basis the information discussed in this material, there may be
regulatory, compliance, or other reasons that prevent us from doing so.
This document is being supplied to you solely for your information, and its contents, information or data may not be reproduced,
redistributed or passed on, directly or indirectly.
Neither Angel Broking Pvt. Limited, nor its directors, employees or affiliates shall be liable for any loss or damage that may arise from
or in connection with the use of this information.